
420 ppm... Blaze It. The Dangers of Business as Usual
As a back to 'business as usual' looms in the aftermath of a coronavirus recovery, the Earth has broken a new CO2 concentration milestone, recording over 420 parts per million (ppm) CO2 - a level not seen since the Miocene epoch 10- 20 million years ago.

When the World Health Organization (WHO) declared COVID-19 a global pandemic on March 11th, flights were canceled, commercial shipping was thrown into disarray and markets crashed. Working from home became the norm. Friends and family were separated. And who can forget the run on toilet paper?? Jokes aside, this virus has had devastating consequences, with almost 3 million succumbing to the disease, and over 138 million infected. It's clear that COVID-19 has altered our lives - for better or worse. Nonetheless, what has been promising - maybe the silver lining in all of this - is that the effects of the resulting lock downs and economic downturn have resulted in significant reductions in CO2 emissions. Approximately 8.8% in the first half of 2020 when compared to the same period in 2019.
Yet 1 year on, and due largely to the efforts of a global vaccine drive, we are starting to see the light at the end of the tunnel (the battle is far from over though, as mutations and less efficacious vaccines continue to cause problems). With the New York Stock Exchange at all time highs and the vaccine rollout, talk of business as usual is as infectious as ever. The explanation is a simple one - in the West, we've become accustomed to a certain quality of life. Whether it's travelling, or having the next high tech gadget, our personal freedom in the West reigns supreme - climate change be damned.
However, despite this short respite, the reality is that the mean annual CO2 concentration during 2020 didn't decrease despite the decrease in economic output. In fact, the mean annual CO2 concentration increased - from 411.66 (in 2019) to 414.24 ppm in 2020. Furthermore, since records began in 1958/9, the CO2 concentration (mean per annum) at Mauna Loa has never decreased. I think this is a powerful statement, and deserves to be repeated: we as a species have never been able to decrease the amount of CO2 in the Earth's atmosphere. Let that sink in for a moment, since I'll come back to that point later.
We can look at the historical change in CO2 concentration from the previous year since records began. Starting at 1959, Figure 1 plots the change in the mean annual CO2 concentration from the previous year i.e., the change from one year (say 1965) to the very next (1966). I've fitted here a linear line to the data (taking into account uncertainty in the CO2 measurement), and it shows very clearly that not only has the CO2 concentration never decreased, but that it is increasing.
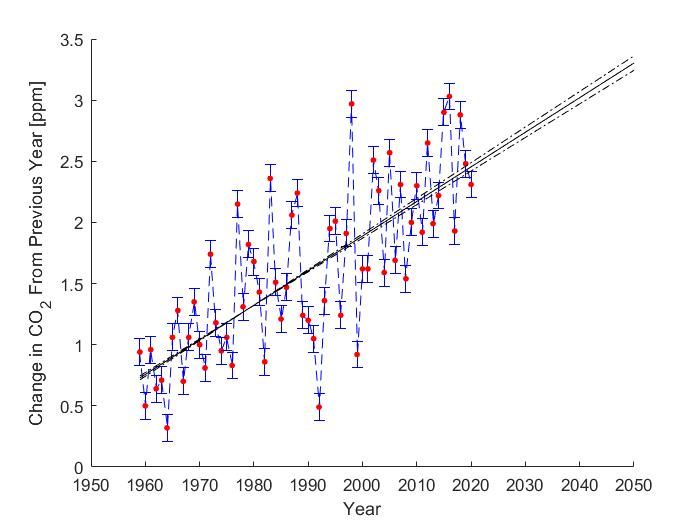
Extrapolating the curve to the year 2050, and summating the year upon year increases yields a value of approximately 87 ppm being added to the total CO2 concentration (this is a very simple model, in reality the increase may not be linear, but serves as a decent fit to the data thus far - and may not be too far off from actual numbers). It took us 60 years to add 100 ppm of CO2 (~316 ppm in 1959 to ~414 ppm in 2020), and if business as usual continues for the next 30 years, we are poised to do the same in half the time. This would take the Earth up to a CO2 concentration of at least 501 ppm (ignoring the effect of tipping points, which would increase this value). Figure 2 shows a historical graph of the concentration of CO2 in our atmosphere. The last time the concentration of CO2 was > 400 ppm was in the Miocene, around 10 - 20 million years ago.
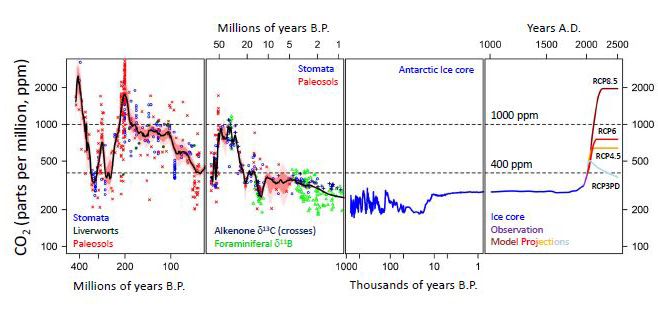
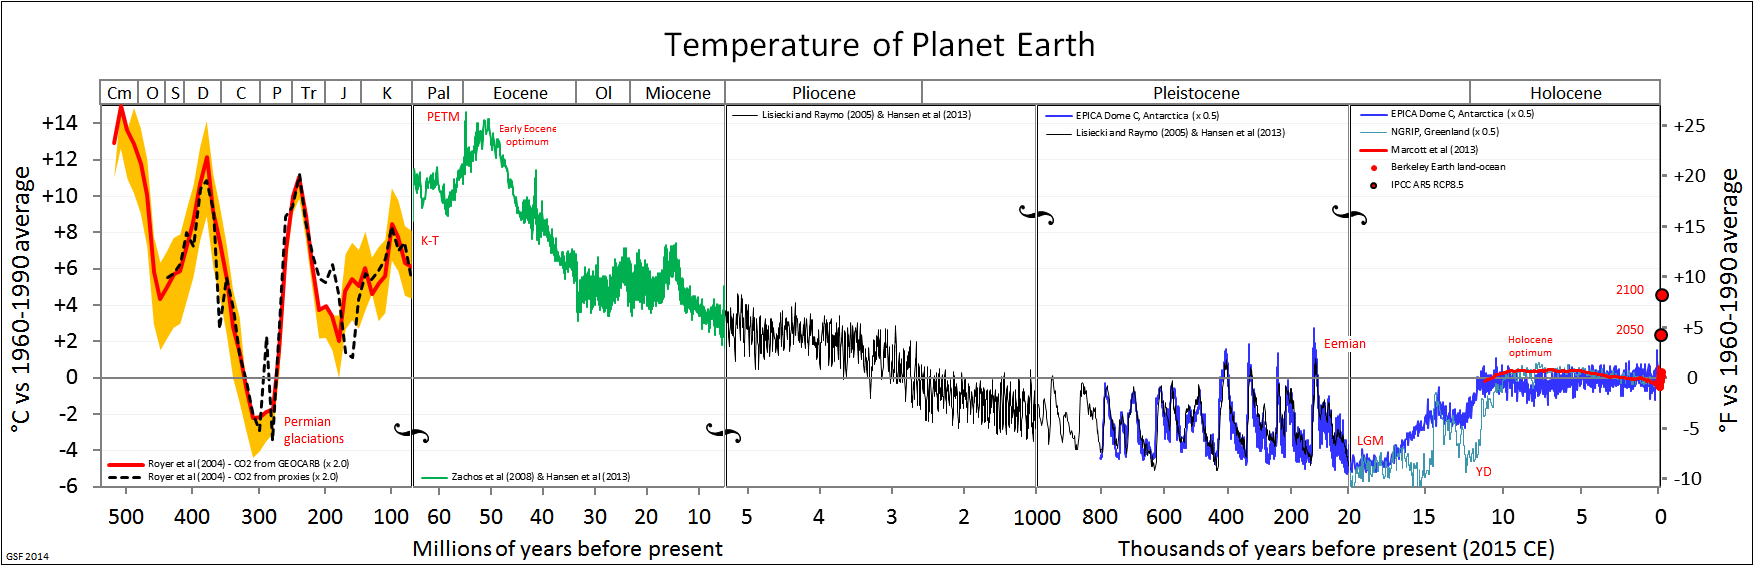
Why is this important? Well, CO2 concentration correlates with temperature over the last 800,000 years. Greenhouse gases such as CO2 and methane (a far more effective greenhouse gas, which has increased >750% since pre-industrial levels) follow the Earth's temperature change as far as the ice core data can tell us. The science of the greenhouse effect is well understood - relatively simple chemistry and physics. (Milankovitch cycles can affect climate, but we are actually in a period of cooling now - clearly not in agreement with observations which show warming. Even so, it is a gross oversimplification to attribute all warming or cooling to this effect, see: NASA1 and NASA2). Figure 3 shows the historical temperature changes (with respect to the 1960 - 1990 mean temperature) versus time on a geological timescale. What is striking about Figure 3, is that is possesses many of the same features as Figure 2 - i.e., changes in CO2 seem to coincide with temperature changes - as expected. If business as usual continues to 2050 (>500 ppm CO2), geological data suggests we are heading for a temperature > 2 °C (above 1960 - 1990 levels, which is already higher than pre-industrial baselines!!!!).



As a direct result of our emissions, 17 of the 18 hottest days since records began in 1850, have all occurred after the year 2000. The literature is clear: a severely warmed climate (> 2 °C) would result in catastrophe. In order to prevent this potential catastrophe, the Intergovernmental Panel on Climate Change (IPCC) used 'Representative Concentration Pathway' (RCP) models from the literature in order to guide climate policy. The models, which were also published in the Fifth Assessment Report in 2014, described the amount of radiative forcing by the year 2100 that one would expect given the amount of CO2 equivalent emissions. For example, in RCP8.5, we'd expect a radiative forcing of 8.5 W/m^2 by 2100, leading to a mean temperature increase of 3.7 °C. The models are shown in Figure 4:
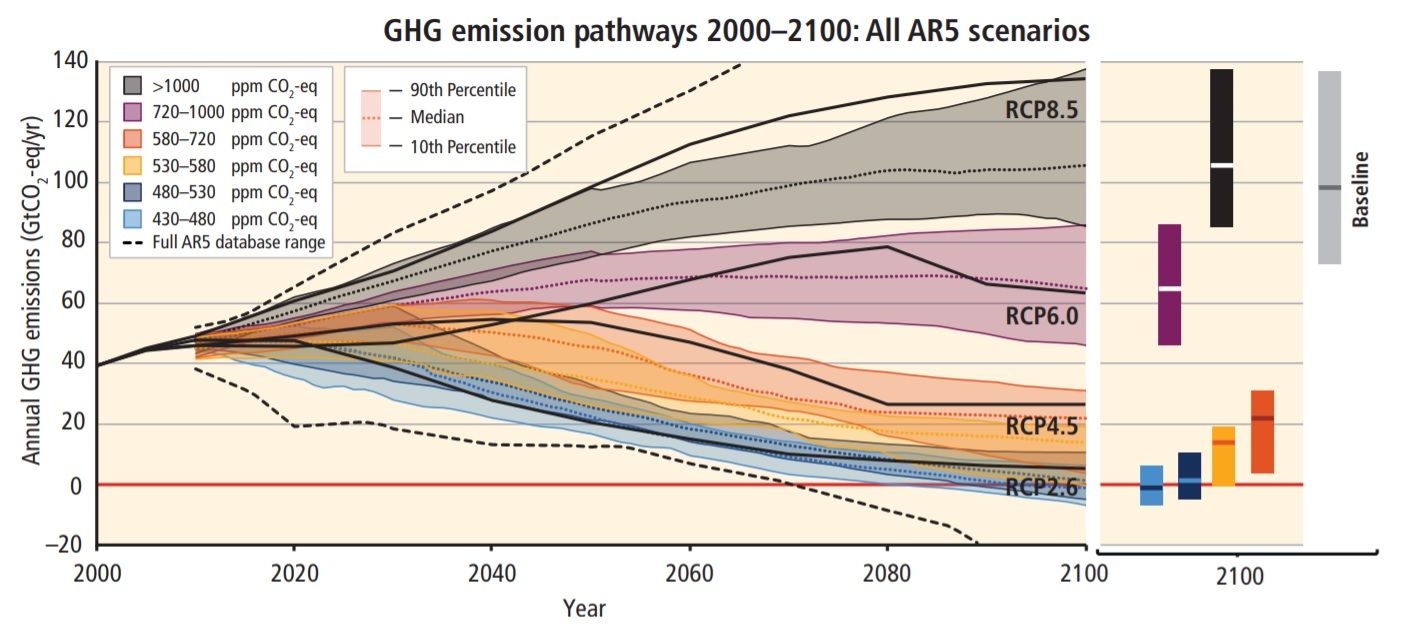
A recent report in the journal PNAS has found that our historical emissions match very closely (1% difference) with RCP8.5 - much closer than any other RCP scenario. A business as usual or business as intended outcome falls between RCP4.5 and RCP8.5. Even if RCP4.5 seems more likely, RCP4.5 assumes the active removal of CO2, and the decline of CO2 emissions by 2045. It is yet to be proven whether we can achieve this, technologically or otherwise. Heck, we are already at a CO2 equivalent concentration of over 500 ppm! Furthermore, these models do not take into account tipping points and positive feedback loops (see: clathrate gun hypothesis), which are almost certain to pose further problems for decreasing the total greenhouse gas emissions as we reach higher emissions.
Although brief, the coronavirus related shutdowns were successful in curbing CO2 emissions. A drop of approximately 8% is just over what is needed to curb complete climate catastrophe. But we need to decrease emissions 8 percent per year, every year, for 10 years!! Not just a few months of the year. The sheer enormity of this task is difficult to fathom, and will require cooperation on a global scale. It's disheartening when the climate scientists and climate aware have already started moving to cooler areas, you start to wonder if it's all just an exercise akin to pissing in the wind.
I'd like to say I'm hopeful, but I'm also no stranger to history.